
Databricks Notebooks are a popular tool for interacting with data using code and presenting findings across disciplines like data science, machine learning, and data engineering. Notebooks are, in fact, a key offering from Databricks for generating processes and collaborating with team members thanks to real-time multilingual coauthoring, automated versioning, and built-in data visualizations.
How exactly do Databricks Notebooks work? And how does this Notebook fit into the Databricks lakehouse architecture and tools like the Databricks Unity Catalog? Keep reading to find out.
Databricks Notebooks Explained

Databricks Notebooks help data practitioners develop data science and ML projects by providing a fully controlled and highly automated developer experience. Notebooks integrate seamlessly with the Databricks Lakehouse Platform to help users get started quickly, develop using context-aware tools, and share findings effortlessly.
Notebooks provide native capabilities that let data practitioners manage their complete data journey in a single location. You can use data science, computation, and visualization tools without any additional setup, allowing you to concentrate on the most important task at hand: understanding your data. Notebooks use facts about your data, such as its provenance, linked tables, and popularity, to present ideas relevant to your work.
Notebooks include a context-aware AI helper, which lets you query data using a conversational interface to increase productivity.
Users can collaborate to build and share projects with the whole data team in one location. Cooperation is easier because you can store markdown comments and code in several languages in order to communicate critical context with others. You can also view reports and use logs and forks to learn how the analysis is being consumed.
Databricks Notebooks Key Features
Multiple Languages Support
When using Databricks Notebooks, you can write code in Python, SQL, Scala, and R – all in one Notebook.
Quick Visualization
You can create and share dashboards for seamless data visualization. Thanks to built in data visualizations and data profiles, you can easily explore, visualize and summarize data. Databricks Notebooks also give you the option to launch or execute a Delta Live Tables pipeline.
Download CSV
You can read and write CSV files with Databricks using Python, Scala, R, and SQL. Databricks recommends using a temporary view, but SQL can also read CSV directly. That’s because when reading the CSV file directly, you can’t specify data sources or data structure.

You can download the results from your notebook – the results will be stored to your computer as a CSV file called export.csv.
Built-in Notebook Scheduler

The Notebooks Scheduler lets you create regularly scheduled jobs to carry out activities like multi-notebook processes automatically, which comes in handy for data science project. You can access and browse tables and volumes, as well as share your notebooks, together with any associated files and dependencies, in a Git-based repository.
Databricks Notebooks Benefits
- Support for multiple languages – you can write code in Python, SQL, Scala, and R.
- Environment personalization – Databricks Notebooks let you easily personalize your environment by adding libraries of your choosing.
- Job scheduling – create regularly scheduled jobs to take care of tasks and processes automatically (for example, multi-notebook processes).
- Easy access to tables and volumes – you can access and browse both easily with Databricks Notebooks.
- Storage in a repository – you can store your notebooks together with any associated files and dependencies in a Git-based repository.
- Easy options for creating and sharing dashboards.
- Ability to launch or execute a Delta Live Tables pipeline.
How to Use Databricks Notebooks
Cells
Notebooks are made up of two kinds of cells: code cells and markdown cells. Runnable code lands in code cells. Markdown cells include markdown code that turns into text and visuals when you run it. You can also use markdown code to document or explain your code.
To arrange your work, you can easily add or remove cells from your notebook. Also, Databricks Notebooks give you the option to execute a single cell, a group of cells, or the entire notebook at the same time.
Note that a notebook cell can only hold 10MB and its output is limited to 20MB.
Output Area
When you connect a notebook to a cluster and run one or more cells, it acquires state and shows outputs. At this point, you can:
- Clear the notebook state and outputs,
- Remove all cell outputs (handy if you ‘re sharing the notebook and don’t want any results included there),
- Clear the state and run all to clear the notebook state and start a fresh run,
- Display the outcomes (when a cell is executed, the table results can return up to 10,000 rows or 2 MB, whichever is less),
- Download the results (you can save a cell result with tabular output to your local workstation).
Basic Editing Notebooks
Naturally, Databricks Notebooks provide multiple options for editing notebooks. To open a notebook, use the workspace Search tool or the workspace browser to find it, and then click on the notebook’s name or icon.
You can now explore the tables and volumes available for the notebook using the schema browser. To launch the schema browser, click the notebook data icon on the left side of the notebook.
You can directly enter a table or column name into a cell by placing your cursor in the cell where you wish to input the name.
You can also use the text search and replacement option. Select Edit > Find and Replace to find and replace text within a notebook. All other matches will be marked in yellow, with the exception of the current match, which will be highlighted in orange.
Key Operations of Databricks Notebooks
Creating a Databricks Notebook
To create a blank notebook, click the New button in the workspace sidebar and pick Notebook from the menu to create a new notebook in your default folder.
Databricks will build and launch a new, blank notebook in your default location. The default language is the most recently used language, and the notebook is automatically connected to the most recently used compute resource. You can identify the notebook path by using the dbutils command.
Importing a Databricks Notebook
You can import an external notebook from a URL or a file. A ZIP archive containing notebooks exported in bulk from a Databricks workspace can also be imported.

In the sidebar, click Workspace, right-click a folder and choose Import. Enter the URL or go to a file that contains a supported external format or a ZIP archive of notebooks exported from a Databricks workspace.
When you choose a single notebook, it will be saved in the current folder. If you choose a DBC or ZIP archive, the current folder’s folder structure will be reconstructed, and each notebook will be imported.
Databricks Notebooks Visualizations

Databricks supports charts and visualizations in both Databricks SQL and Notebooks.
Using the display Function
To quickly see data with a variety of integrated visualizations, you can use the display() function. You can check the list of available visualization types by using display-charts. Next, pick the Map icon to generate a map depiction of the preceding section’s sale price SQL query.
Using the displayHTML Function
To view HTML code such as Javascript, D3, and SVG use the displayHTML method. The maximum size for a notebook cell, including contents and outpu, is 16 MB, so ensure that the size of the HTML you pass to the displayHTML function doesn’t exceed this value.
When linking to external resources, use https:// instead of http://. Otherwise, graphics, images, or Javascript code may not render correctly due to mixed content errors.
Types of Visualizations With Databricks Notebooks
Dashboards
Dashboards enable you to produce graphs and visualizations and then share them with your team in presentation style.
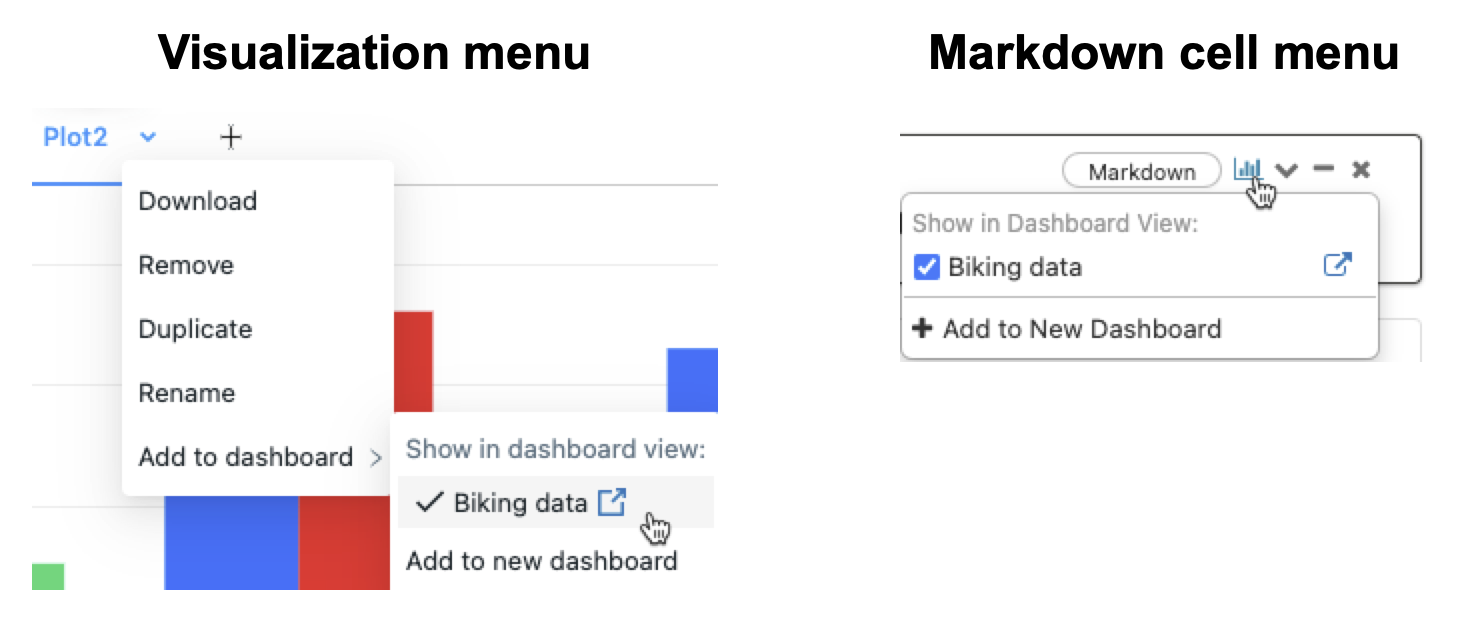
You can create a new dashboard by adding an item to it. Click the down arrow next to the tab name and select Add to dashboard > to add a visualization or output results table to a dashboard.
You have full control over the size and location of dashboard elements, so you can adjust it to the needs of your data science project. For example, to resize an item, click the corner resize symbol in the lower-right corner of the dashboard and drag your mouse until the item is the desired size. To move an object to a different location, click it and hold it while moving your mouse.
Integration with Plotting Libraries

Plotly is an interactive graphing library supported by Databricks in version 2.0.7. To start using it, you need to install the Plotly PyPI package and add it to your cluster. Databricks recommends using Plotly Offline within Databricks Notebooks.
When dealing with massive datasets, Plotly Offline may not work properly. Reduce the size of your dataset if you discover any performance concerns.
Tables and In-Built Charts
You can create a table with data from a sample CSV data or convert the CSV data to Delta Lake format and build a Delta table.
In a Databricks workspace, you can use one of the following built in data visualizations types defined as charts:
- Bar
- Line
- Area
- Pie
- Histogram
- Heatmap
- Scatter
- Bubble
- Box
- Combo


The charts have the same set of setup choices, and not every configuration option is available for each of them. You can change colors and select unique colors, or use predefined color schemes.
Databricks Notebooks Widgets
You can add parameters to your notebooks and dashboards using input widgets. The widget API includes methods for creating various sorts of input widgets, removing them, and retrieving bound data.
Databricks widgets are most useful for creating a notebook or dashboard that can be re-run with varied settings in a data science project. They also come in handy for exploring the results of a single query with several parameters quickly.
Working With Databricks Notebooks
Revision History
Databricks notebooks have automatic versioning capabilities. This means you get a version history, allowing you to explore and restore prior snapshots of the notebook. You can add comments, restore and remove versions, and even wipe the entire version history.
Databricks and Git work seamlessly together, and you can synchronize your Notebook work with a remote Git repository.
To display the notebook version history, click the version history button in the right sidebar to view notebook versions.
Comments
You can leave a comment on one of the Notebook versions. To do that, select the right version and click save. You can enter a comment in the Save Notebook Version dialog.
Make sure to save the file. The notebook version with the supplied comment will be stored.
Set Permissions
Individual permissions define a user’s ability to edit workspace objects when using workspace object access control. You can use Databricks Terraform provider and databricks_permissions to handle permissions in an automated configuration.
Databricks Notebooks have five permission levels:
- No Permissions,
- Can Read,
- Can Run,
- Can Edit,
- Can Manage.
Each permission’s powers are listed in the table below.

Conclusion
Both Databricks and Jupyter Notebook are interactive computing environments that are commonly used by data practitioners in data science and machine learning settings.
While Databricks is a fully managed cloud-based platform, Jupyter Notebook is an open-source online application that requires you to set up your environment, install the required dependencies, and deploy it on your own hardware or cloud infrastructure.
Also, Databricks supports multiple languages natively, whereas Jupyter Notebook is generally used with Python. It does, however, support many additional programming languages via kernel extensions.
A Databricks workspace has a rich array of built in collaboration features that allow multiple users to work on the same codebase, share notebooks and visualizations, and even perform real-time pair programming. Let’s not forget that Databricks was built for big data processing and can easily grow to accommodate enormous datasets. And it’s well integrated with other big data tools such as Apache Spark, Apache Hadoop, as well as cloud-based platforms such as AWS, GCP, and Azure.
To sum up, Databricks capabilities provide a fully managed, scalable, and collaborative platform for any team of data practitioners in data science or data engineering – or even machine learning teams fine-tuning their machine learning workflows.
If you’d like to boost your data versioning capabilities, consider using the open-source tool lakeFS. Here’s a guide to the integration between Databricks and lakeFS.


